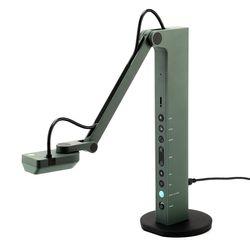
What is the Ipevo visualiser?
The Ipevo visualiser is a tool that allows you to capture documents, live or pre -recorded drawings of graphs or mathematical worked examples, textbooks, artwork and 3D objects. It also allows you to stream real-time images and recordings directly to your PC. This blog provides a short overview of my experience with the visualiser.
Getting started
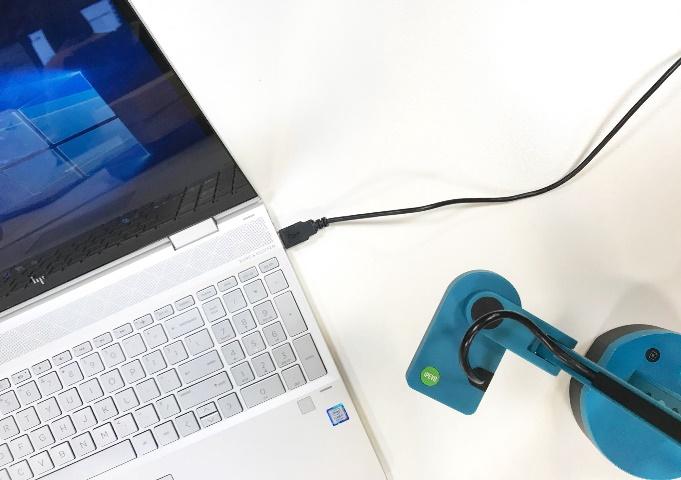
The Ipevo visualiser is compatible with most monitors with an HDMI input and is very easy to use.
There are two steps:
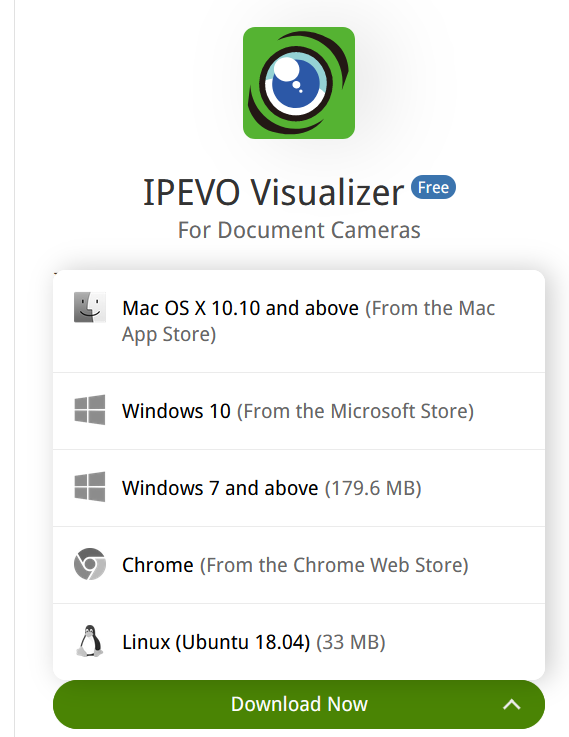
- Download the Ipevo software on to your PC. I have found that if you choose Windows 7 and above when downloading, it works best.
- Plug in the visualiser to your PC. You are good to go!
Favourite features
As an Economics teacher, it is very useful for online tutorials and workshops. It allows you to:
- Pre-record a worked example with drawings and computations, upload the video to stream and add it to your Moodle page.
- Integrate a worked mathematical solution into a live or pre-recorded Microsoft Teams session.
- Annotate on the screen (this is especially useful if you have a regular laptop and do not have a touchscreen with a stylus pen to draw freehand on the screen)
What the students say
‘I loved the visualiser because I could clearly follow each step of the process and go back over it if I needed to’
‘I understand the calculation in class but when I go home, I can’t remember. Having a recorded example allows me to go over it again and again’.
Resources
Demo on how to install IPEVO software and simple tips to get you started – Visit YouTube